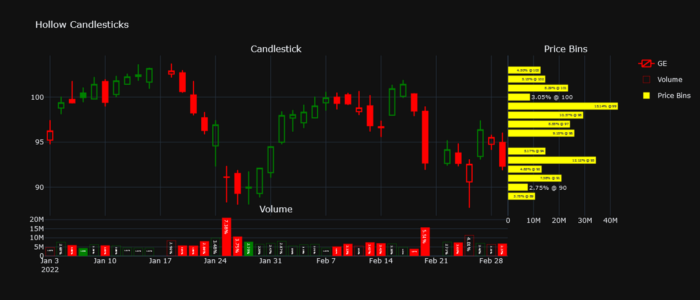
In this article, we explore 3 ways of making more insightful candlestick plots. We will be making our plots with the Python programming language and the Pandas and Plotly libraries. The final chart will look as follows:
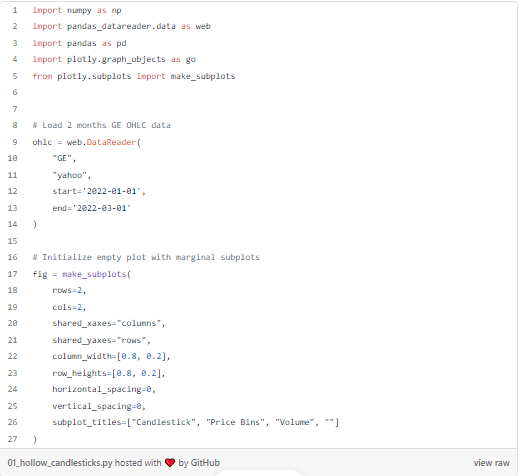
We start by importing the necessary libraries, loading a stock price from Yfinance, and initializing an empty plot composed of one main subplot and two marginal subplots.
From here, we can add the first improvement to our candlestick plot.
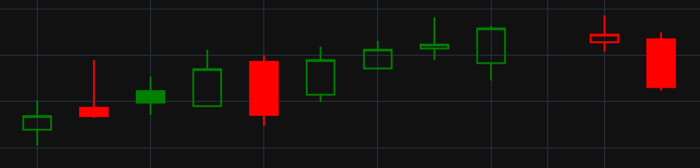
Converting standard candlesticks into hollow candlesticks
A hollow candlesticks chart is a type of candlestick chart that uses the outline color and the fill color of candlesticks to display more information. Unlike standard Japanese candlesticks, hollow candlesticks are green when the close is higher than the previous close and red otherwise. On top of this, the candlesticks are hollow when the close is higher than the open and solid otherwise.
Plotly’s graph_objects.Candlesticks does not support this out of the box. However, we can still achieve the desired outcome with a bit of hacking.
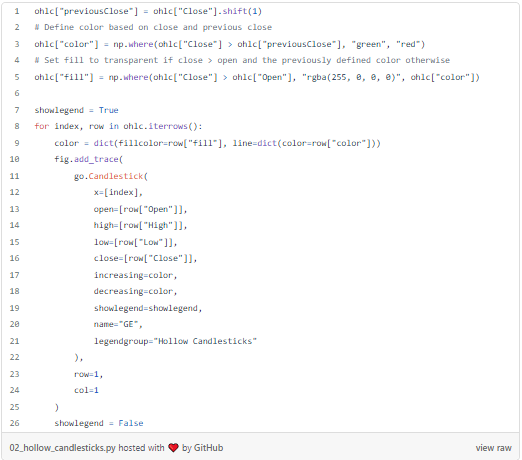
Inside the pandas data frame, we start by defining the outline and fill color based on the conditions of hollow candlesticks. Note that rgba(255, 0, 0, 0) allows us to define a transparent color by setting the alpha value (last number) to zero. Then, iterating over the rows of our data frame, we add each candlestick to our main subplot by specifying the same border and fill color in the increasing and decreasing properties.
The mixture of green/ red and filled/ hollow candlesticks allows us to have a better understanding of the price action. But what if we want to depict trading volumes on top of our price data?
2. Plot trading volumes per day
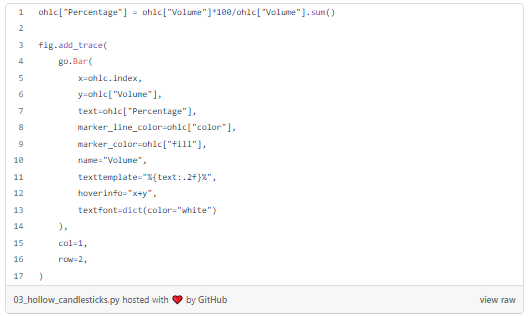
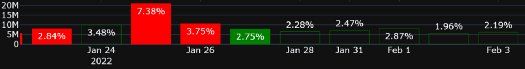
To depict the trading volume per day, we add a bar chart to the marginal subplot beneath our main subplot. One great feature of Plotly is that you can always add more information to a plot by adding it to the hover or the text labels. In our case, we add the percentage of the daily trading volume over the total trading volume as text to our plot.
As you may notice, we specified the border and fill color of each volume bar to be the same as that of its corresponding candlestick.
3. Plotting trading volume per price bracket
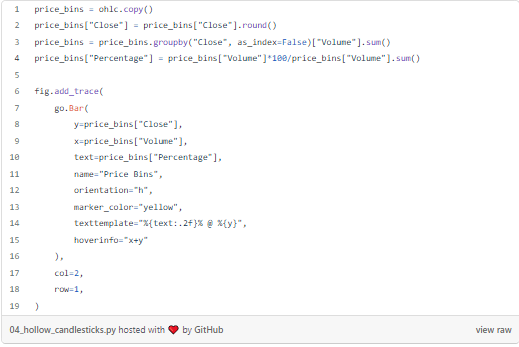
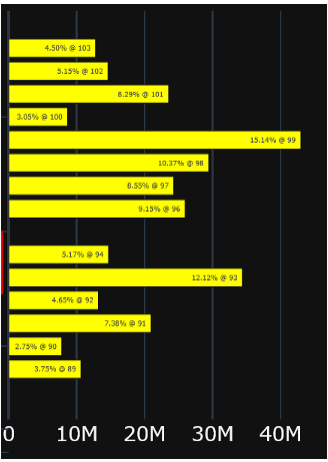
The final trick up our sleeves consists in plotting a histogram of the trading volume versus the price. Such plots are particularly useful for identifying points of support and resistance.
We could use Plotly’s graph_objects.Histogram but to equally display the volume as a percentage of the total volume, we aggregate the data with pandas in bins of 1$ and use Plotly’s graph_objects.Bar. We flip the bar chart horizontally and add the figure to the marginal subplot to the right of the main subplot.
Conclusion
With these three simple tricks, I hope to have shared with you a new and easy way of transforming your Plotly candlestick charts into even more powerful trading analysis tools. The whole code can be found on Github. Comments and questions are always more than welcome.
If you are interested in other innovative ways of visualizing financial data, why not try Raindrop charts to get a better understanding of price actions and trading volumes.